Project
Overview
You have now completed the full course — Python foundations, Pandas, visualization, EDA, SQL, feature engineering, classification, regression, advanced ML, deep learning, and NLP. This final capstone is where everything converges. You will select a problem, find or source a dataset, execute the complete workflow independently, and produce a polished artifact that demonstrates professional-level data science work. This lesson introduces Kaggle as a platform for finding datasets and competitions, discusses what makes a data science portfolio compelling, and gives you the scaffolding to execute your final project.
Learning Objective
By the end of this lesson, you will have learned how to:
- Navigate Kaggle to find datasets, competitions, and community notebooks
- Evaluate a project idea for scope, feasibility, and portfolio value
- Execute a complete end-to-end data science project independently
- Structure a GitHub-hosted notebook as a professional portfolio artifact
Key Terms
Kaggle — A data science platform owned by Google that hosts machine learning competitions, a public dataset repository, free GPU-accelerated cloud notebooks, and a large community of practitioners. It is the most widely used platform for competitive and hobbyist data science.
Kaggle competition — A structured prediction challenge where teams submit predictions on a held-out test set and are ranked on a public leaderboard. Competitions range from beginner-level practice problems to multi-million-dollar industry challenges.
Kaggle notebook (kernel) — A cloud-hosted Jupyter notebook that runs entirely in the browser on Kaggle's infrastructure. Notebooks can be made public and serve directly as portfolio pieces.
Leaderboard — A ranked table of competition submissions evaluated against a hidden test set. The public leaderboard scores a subset of rows during the competition; the private leaderboard (the final ranking) scores the remainder after the deadline.
Bronze / Silver / Gold medal — Kaggle's achievement system for competition placements and notebook/discussion votes. Accumulating medals across categories advances your profile tier from Contributor through Expert, Master, and Grandmaster.
Portfolio — A curated collection of completed projects — typically GitHub repositories and Kaggle profiles — that demonstrates a practitioner's skills to employers, collaborators, and the broader community.
Ensemble — A technique where predictions from multiple models are combined (averaged, stacked, or blended) to produce a final prediction that typically outperforms any individual model. Common in competition-winning solutions.
Introduction
Most data science hiring decisions come down to one question: can you actually do the work? Degrees and certificates signal potential; projects demonstrate execution. A recruiter who sees a well-structured notebook on GitHub — with a clear problem statement, honest EDA, documented cleaning decisions, and a comparison of multiple models — has direct evidence that you can navigate a real dataset from start to finish.
Kaggle is the fastest path to building that evidence. It solves two problems simultaneously: finding good datasets and finding community. Every Kaggle dataset comes with discussion threads, existing notebooks, and often data dictionaries. Every competition exposes you to how practitioners at all levels approach the same problem. Studying top solutions after a competition closes is one of the most efficient forms of ML education available.
This capstone is your opportunity to produce the kind of work you would genuinely share with a hiring manager or collaborator. Treat it accordingly.
Introducing Kaggle
What Kaggle Offers
Kaggle is organized around four main areas:
| Area | What it contains | How you use it |
|---|---|---|
| Competitions | Prediction challenges with ranked leaderboards | Practice end-to-end ML on real problems; compare against thousands of others |
| Datasets | 250,000+ public datasets across every domain | Find data for personal and capstone projects |
| Notebooks | Free cloud notebooks with GPU/TPU access | Run experiments without local setup; publish as portfolio pieces |
| Courses | Short, free micro-courses on ML topics | Fill specific skill gaps quickly |
Signing Up and Getting Oriented
Create a free account at kaggle.com. Your Kaggle profile becomes a secondary portfolio page — it displays your competition rankings, published notebooks, and discussion contributions. Fill out your profile before submitting anything publicly.
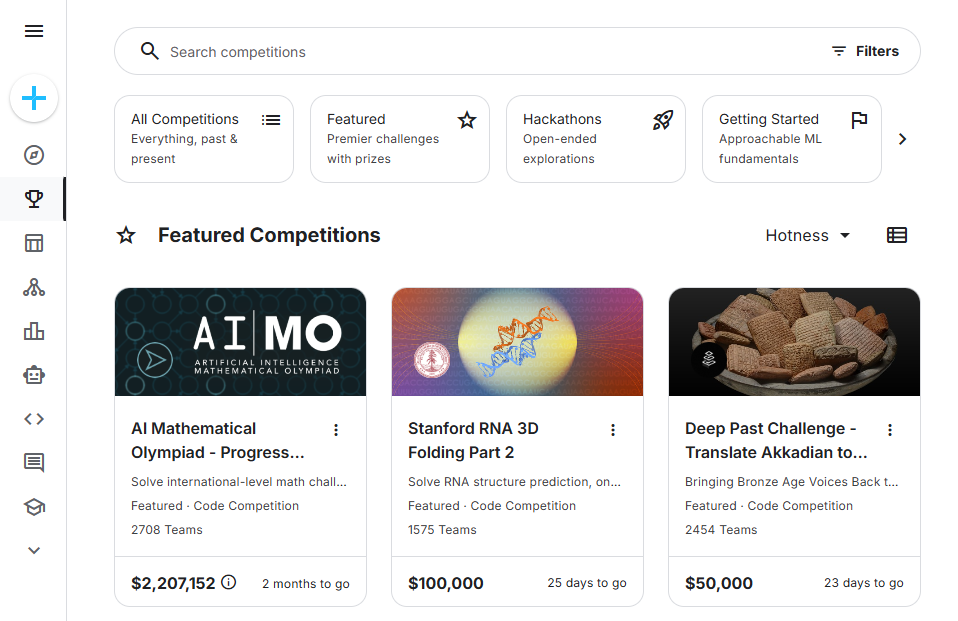
Once logged in, the Competitions tab lists all active and completed challenges. Filter by "Getting Started" to find practice competitions with no prize and no deadline — these are specifically designed for learners.
Competition Structure
Every competition follows the same structure:
- Overview — the problem description, evaluation metric, and prize
- Data — downloadable training set (with labels), test set (without labels), and often a sample submission file
- Notebooks — community notebooks shared publicly; many top competitors publish their approach after the competition closes
- Discussion — threads where participants ask questions, share insights, and post findings about the data
Your workflow in a competition:
# 1. Download data from the competition page or via the Kaggle API
# kaggle competitions download -c titanic

import pandas as pd

train = pd.read_csv("train.csv")
test  = pd.read_csv("test.csv")

# 2. Explore
print(train.shape, train.dtypes)
print(train.isnull().mean().sort_values(ascending=False))

# 3. Build a pipeline, make predictions on the test set
predictions = model.predict(test)

# 4. Format submission to match sample_submission.csv
submission = pd.DataFrame({
    "PassengerId": test["PassengerId"],
    "Survived":    predictions
})
submission.to_csv("submission.csv", index=False)

# 5. Submit via the competition page or Kaggle API
# kaggle competitions submit -c titanic -f submission.csv -m "baseline LR"
Kaggle Datasets
Outside of competitions, the Datasets tab lets you search and download data on virtually any topic. Dataset pages include a preview, a schema, usage notebooks written by other users, and a discussion section. This is often a better starting point than searching Google for a CSV file — the data is versioned, documented, and already has community notes about quality issues.
To download a dataset programmatically:
# Install the Kaggle API (one-time setup)
# pip install kaggle
# Place your kaggle.json API token in ~/.kaggle/kaggle.json

# Then download any dataset:
# kaggle datasets download -d datasnaek/youtube-new
Recommended Competitions and Datasets
Competitions for Beginners
These "Getting Started" competitions have no deadline and are specifically designed for practice. They use familiar problem types and well-documented data.
| Competition | Problem type | Skills practiced | Why it's good for learning |
|---|---|---|---|
| Titanic: Machine Learning from Disaster | Binary classification | Feature engineering, logistic regression, tree models | The canonical beginner problem; enormous community of shared notebooks |
| House Prices: Advanced Regression Techniques | Regression | Encoding 80 features, regularization, ensembling | Directly builds on module 11; top solutions involve stacking |
| Digit Recognizer | Multi-class classification | CNNs, MLPClassifier, image data | Connects to module 14; MNIST with a leaderboard |
| Natural Language Processing with Disaster Tweets | Binary text classification | TF-IDF, fine-tuning, BERT | Good NLP entry point from module 15 |
| Spaceship Titanic | Binary classification | Missing value imputation, feature interaction | Similar structure to Titanic with fresher data |
Intermediate Competitions
These are completed competitions with public leaderboards and full solution write-ups available.
| Competition | Problem type | Notable techniques in top solutions |
|---|---|---|
| Store Sales — Time Series Forecasting | Regression / time series | Lag features, LightGBM, temporal cross-validation |
| Porto Seguro's Safe Driver Prediction | Binary classification | Class imbalance, feature interactions, stacking |
| Santander Customer Transaction Prediction | Binary classification | Statistical features, pseudo-labeling, blending |
| Tweet Sentiment Extraction | Span extraction (NLP) | BERT token classification, post-processing |
After any completed competition, read the "Discussions" tab — top finishers typically post detailed write-ups explaining every decision they made.
Standalone Datasets for Portfolio Projects
If you prefer a self-directed project outside of a competition, these datasets are well-documented, freely available, and support interesting questions.
| Dataset | Kaggle path | Suggested question | Problem type |
|---|---|---|---|
| Credit Card Fraud Detection | mlg-ulb/creditcardfraud | Which transactions are fraudulent? | Binary classification (severe class imbalance) |
| NYC Taxi Trip Duration | c/nyc-taxi-trip-duration | How long will this taxi ride take? | Regression (geospatial + time features) |
| Amazon Fine Food Reviews | snap/amazon-fine-food-reviews | Is this review positive or negative? | NLP classification |
| Mental Health in Tech Survey | osmi/mental-health-in-tech-survey | Who seeks mental health treatment? | Binary classification + EDA |
| World Happiness Report | unsdsn/world-happiness | What factors predict national happiness? | Regression + EDA |
| COVID-19 World Cases | imdevskp/corona-virus-report | How did case trajectories differ by country? | EDA + time series visualization |
| Video Game Sales | gregorut/videogamesales | What genres and platforms drive sales? | EDA + regression |
| Airline Passenger Satisfaction | teejmahal20/airline-passenger-satisfaction | What predicts customer satisfaction? | Binary classification + feature importance |
Building a Portfolio
What Employers Actually Look For
A strong data science portfolio demonstrates three things:
- Execution — you can take a raw dataset from nothing to a trained, evaluated model
- Communication — you can explain what you did and why, in writing, without hand-waving
- Judgment — your decisions (which model, which metric, how to handle missing data) reflect understanding, not guesswork
One thorough, well-documented project is worth more than ten notebooks that each stop at model training without interpretation.
GitHub as a Portfolio Platform
Every project should live in its own GitHub repository with:
- A
README.mdthat explains the problem, dataset, key findings, and how to reproduce the analysis - A single main notebook that runs top-to-bottom without errors
- A
requirements.txtorenvironment.ymlso others can reproduce your environment - Clear commit history (not a single "initial commit" with everything)
A README template:
# [Project Title]

## Problem
One paragraph: what are you predicting, why does it matter, what dataset are you using?

## Dataset
- Source: Kaggle / UCI / other
- Size: N rows × M features
- Target: column name, type (continuous / binary / multi-class)

## Key Findings
- [Finding 1 from EDA]
- [Finding 2 from EDA]
- [Model comparison summary]

## Results
| Model | Metric 1 | Metric 2 |
|-------|---------|---------|
| Baseline | ... | ... |
| Best model | ... | ... |

## How to Reproduce
1. Clone the repo
2. pip install -r requirements.txt
3. Run notebooks/analysis.ipynb top to bottom

## Files
notebooks/analysis.ipynb — main analysis
data/raw/ — original dataset (or link to Kaggle source)
Notebook Quality Checklist
Before sharing any notebook publicly, verify:
- Runs top-to-bottom without errors in a clean kernel
- Every visualization has a written interpretation, not just a title
- Cleaning decisions are explained (why you dropped a column, why you filled a value)
- Model comparison uses the same train/test split for all models
- Conclusion states the best model's performance in plain language ("the model predicts house prices within $22,000 on average")
- Limitations are acknowledged honestly
- No cell outputs contain personal data or credentials
Portfolio Breadth Suggestions
A portfolio with three to four projects covering different problem types signals broad competence:
| Project | Demonstrates |
|---|---|
| Regression with feature engineering | Core tabular ML skills |
| Binary or multi-class classification | Classification pipeline, evaluation metrics |
| NLP project (sentiment, topic, summarization) | Text data handling, transformers |
| EDA-only deep dive | Storytelling, visualization, domain insight |
| Kaggle competition notebook | Competitive awareness, iterative improvement |
You do not need all five before applying for jobs. Two excellent projects are more compelling than five mediocre ones.
Publishing Kaggle Notebooks
Any notebook you run on Kaggle can be made public with one click (Settings → Sharing → Public). Public notebooks are indexed and discoverable. A well-documented notebook on a popular dataset will receive upvotes and comments from the community — this is useful feedback and builds your Kaggle reputation simultaneously.
Your Final Capstone Project
Deliverables
Your final capstone is a single Jupyter notebook hosted publicly — either on GitHub or Kaggle. It must cover the full workflow from raw data to evaluated model, with written interpretation at every stage.
The notebook must include:
| Section | Minimum requirement |
|---|---|
| Problem statement | One paragraph: what are you predicting, why it matters, what dataset you're using |
| Dataset description | Source, size (rows × features), target variable, and a note on any known quality issues |
| EDA | At least five visualizations, each with a written interpretation; findings must connect to later decisions |
| Data cleaning | Every change documented with rationale |
| Feature engineering | At least two engineered or transformed features with justification |
| Model training | At least three models trained and evaluated on the same held-out test set |
| Model comparison | A table of evaluation metrics for all models |
| Hyperparameter tuning | At least one model tuned via cross-validation |
| Conclusion | Written summary of best model performance and honest statement of limitations |
Problem Type
Unlike the other capstones in this course, this capstone is open to any problem type. Choose based on what your dataset and question call for:
| Your target variable | Problem type | Primary metric |
|---|---|---|
| Continuous numeric (price, score, count) | Regression | RMSE, MAE, R² |
| Two categories (fraud/not, survived/not) | Binary classification | AUC-ROC, F1, precision/recall |
| Three or more categories | Multi-class classification | Accuracy, macro F1 |
| Multiple binary labels per sample | Multi-label classification | Hamming loss, subset accuracy |
| Raw text → category | NLP classification | F1, accuracy |
Choosing Your Dataset
A dataset works for this capstone if it:
- Has at least 500 rows and 5 features
- Has a clearly defined target variable
- Requires some cleaning (datasets with no issues leave no room to demonstrate cleaning skills)
- Is publicly available and citable
Before committing to a dataset, run a 10-minute sanity check:
import pandas as pd

df = pd.read_csv("your_dataset.csv")

# Shape and types
print(df.shape)
print(df.dtypes.value_counts())

# Missing data
print(df.isnull().mean().sort_values(ascending=False).head(10))

# Target distribution
print(df["target"].describe())
print(df["target"].nunique(), "unique values")

# For classification: class balance
print(df["target"].value_counts(normalize=True))
Red flags:
- A single feature perfectly predicts the target (nothing left to model)
- More than 50% of rows are missing the target variable
- Fewer than 200 samples after cleaning (too small for reliable cross-validation)
- Every non-target column is free text (NLP is fine as a choice, but scope it carefully)
Scaffold: Project Structure
A well-organized notebook follows this section order:
1. Setup and imports
2. Load data
3. EDA
   3a. Shape, types, missing values
   3b. Target distribution
   3c. Feature distributions
   3d. Correlations / relationships with target
4. Data cleaning
5. Feature engineering
6. Train/test split
7. Baseline model
8. Model 2
9. Model 3
10. Comparison table
11. Hyperparameter tuning (best model)
12. Final evaluation on test set
13. Conclusion
Each numbered section should be a Markdown cell with a heading, followed by code cells, followed by a brief written interpretation of what you found or decided.
Written Summary
Submit alongside your notebook link. Three paragraphs, written for a technically literate colleague who has not seen your notebook:
- Paragraph 1: What dataset did you choose, what question are you answering, and why does the question matter?
- Paragraph 2: What did EDA reveal about the data? What cleaning decisions did that drive?
- Paragraph 3: Which model performed best and why? What does the error mean in practical terms?
Assessment Rubric
| Dimension | Full credit | Partial credit | No credit |
|---|---|---|---|
| Problem framing | Specific prediction target; motivation explained in writing | Target identified but motivation vague | No clear problem statement |
| EDA | 5+ visualizations; each interpreted; findings connect to cleaning | Visualizations present but uninterpreted | Only summary statistics |
| Data cleaning | Every decision documented with rationale | Some decisions documented | Changes made silently |
| Feature engineering | 2+ engineered features; encoding appropriate for feature type | One engineered feature | No feature engineering |
| Model training | 3+ models; same train/test split; appropriate metrics for problem type | 2 models | Only 1 model |
| Evaluation | Metrics appropriate for problem type; cross-validation used | Metrics reported; no CV | Single metric; no CV |
| Hyperparameter tuning | CV-based tuning (GridSearchCV or equivalent) | Manual tuning | No tuning |
| Conclusion | Honest interpretation; limitations acknowledged | Results stated without interpretation | No conclusion |
| Code quality | Runs top-to-bottom without errors; clear section structure | Minor errors; mostly readable | Does not run |
| Written summary | Three paragraphs addressing all three questions | Addresses one or two questions | Not submitted |
Conclusion
You now have the tools, the framework, and the platform. Kaggle gives you access to thousands of real datasets and a community of practitioners who have worked through the same problems before you. Your final notebook — the one you build for this capstone — is the beginning of a portfolio, not the end of one. Every project you add after this one will build on the workflow you establish here: frame the problem clearly, explore before modeling, document every decision, and communicate what you found in plain language.
Data science as a field is too broad for any single curriculum to cover completely. But the workflow is transferable: the way you approached the mushroom dataset in module 10 is the same way you approach a Kaggle competition, a new dataset at a job, or a research question you generate yourself. The tools change; the process does not.