Intro to Data Science
Overview
Welcome to the Data Science curriculum. This is the first lesson of the first module, and its job is to answer a single question before any code is written: what is data science, and why does it matter? By the end of this lesson, you'll understand what data scientists actually do, how the field fits into the broader landscape of technology and business, and what the journey through this curriculum will look like.
Learning Objectives
By the end of this lesson, you will have learned how to:
- Understand core data science concepts and typical tasks.
- Recognize the data science lifecycle (data collection, cleaning, analysis, visualization, modeling, deployment).
Key Terms
Data science: An interdisciplinary field that uses programming, statistics, and domain knowledge to extract insights and build predictive systems from data.
Data: Raw, recorded observations — numbers, text, images, clicks, sensor readings, or any other machine-readable information.
Dataset: A structured collection of data, typically organized as rows (observations) and columns (variables or features).
Feature: An individual measurable variable used as input to an analysis or model. Also called a predictor, attribute, or column.
Label (target): The output variable being predicted or explained — for example, whether a patient has a disease, or the price of a house.
Model: A mathematical function, learned from data, that maps inputs to predictions or decisions.
Algorithm: The step-by-step procedure used to learn a model from data (e.g., linear regression, decision tree).
Exploratory Data Analysis (EDA): The process of examining a dataset to understand its structure, distributions, and relationships before building models.
Pipeline: An ordered sequence of data processing steps — from raw data through cleaning, feature engineering, modeling, and evaluation.
Insight: A meaningful, actionable conclusion drawn from data that informs a decision.
Introduction
Every day, enormous amounts of data are generated — by sensors, transactions, social media, medical devices, satellites, and millions of connected devices. This data is valuable, but only if someone can make sense of it.
Data science is the field dedicated to extracting meaning from data. It combines three areas of expertise:
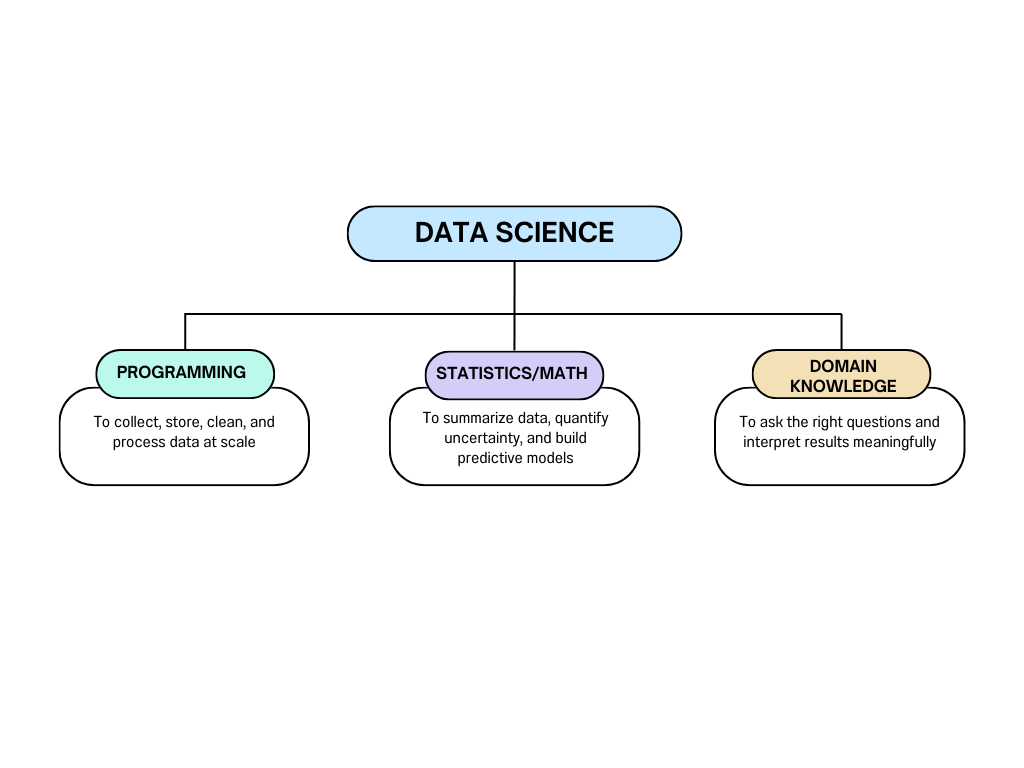
No one is equally strong in all three areas — and that's fine. Teams of data scientists, engineers, and domain experts collaborate on real projects.
What Data Scientists Actually Do
The romanticized image of a data scientist as someone who builds neural networks all day is misleading. In practice, the work looks more like this:
| Activity | Approximate time spent |
|---|---|
| Finding and collecting data | 15% |
| Cleaning and preparing data | 45% |
| Exploratory analysis | 20% |
| Building and evaluating models | 10% |
| Communicating results | 10% |
The most important and time-consuming part of data science is data preparation — not modeling. A mediocre model on excellent data almost always outperforms an excellent model on bad data.
The Data Science Lifecycle
Every data science project — regardless of domain — follows a similar sequence of steps. Understanding this lifecycle is more important than knowing any specific algorithm:
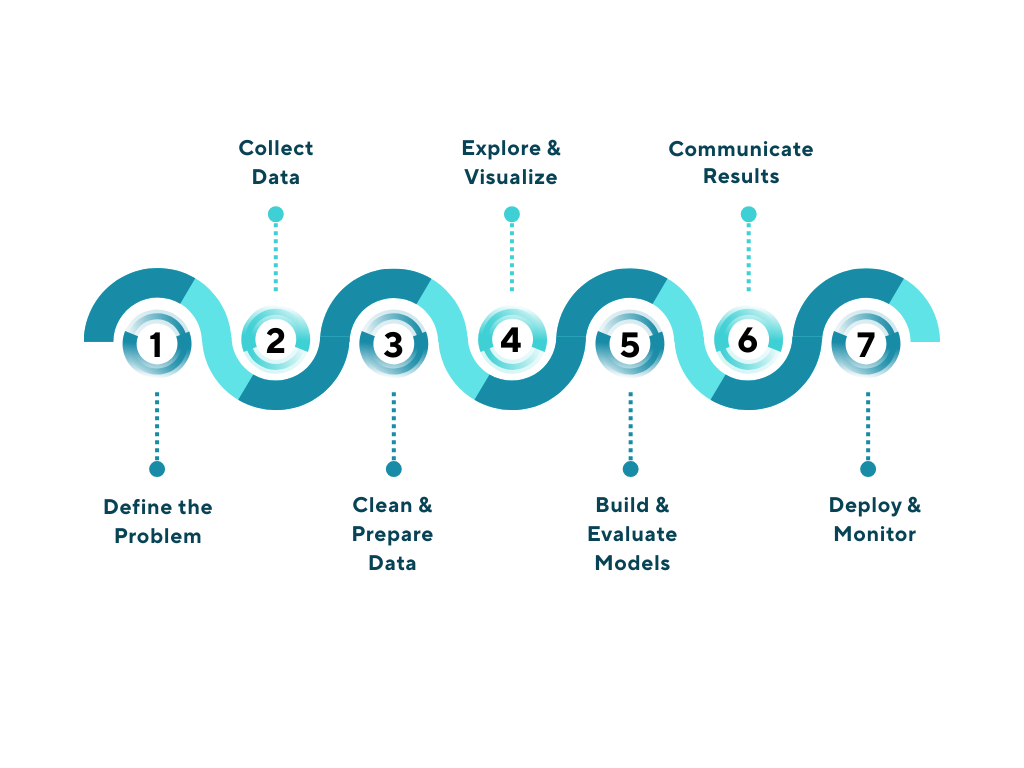
This is not a rigid waterfall — you'll often cycle back. Data analysis reveals cleaning problems. Model evaluation reveals missing features. Stakeholder feedback reframes the problem. The lifecycle is iterative.
Step 1: Define the Problem
Before touching data, answer:
- What question are you trying to answer?
- What does a successful answer look like?
- How will the result be used, and by whom?
A vague question produces a vague result. "Improve customer satisfaction" is not a data science problem. "Predict which customers will churn in the next 30 days" is.
Step 2: Collect Data
Data comes from many sources: databases, APIs, surveys, sensors, public datasets, or web scraping. Collecting the right data — enough of it, representative of the problem — is often harder than it sounds.
Step 3: Clean & Prepare Data
Raw data is almost never ready for analysis. Missing values, duplicate rows, inconsistent formatting, wrong data types, and irrelevant columns all need to be addressed before meaningful analysis can begin.
Step 4: Explore & Visualize
EDA is the stage where you look at the data before drawing conclusions — examining distributions, spotting outliers, understanding relationships between variables, and generating hypotheses. Visualization is the primary tool.
Step 5: Build & Evaluate Models
In supervised learning, you train a model on labeled data and evaluate it on held-out examples it hasn't seen. Model selection, feature engineering, and rigorous evaluation are the core activities here.
Step 6: Communicate Results
A finding no one acts on has no value. Data scientists communicate results through reports, dashboards, presentations, and visualizations — translating technical findings into business language.
Step 7: Deploy & Monitor
A model in production needs to be monitored. Data distributions shift over time. Model performance degrades. Deployment is not the end of the project — it's the beginning of a maintenance responsibility.
Roles in the Field
Data science is broad enough to support many specializations:
| Role | Focus |
|---|---|
| Data Analyst | SQL, dashboards, business reporting, descriptive statistics |
| Data Scientist | End-to-end pipeline: EDA, modeling, communication |
| Machine Learning Engineer | Building and deploying production ML systems |
| Data Engineer | Pipelines, databases, infrastructure for data at scale |
| Research Scientist | Novel algorithms, academic publication, deep technical work |
This curriculum is primarily focused on data science — the end-to-end generalist role that spans analysis, modeling, and communication.
The Tools You'll Use
Throughout this curriculum, you'll work with a specific set of tools. All are free, widely used in industry, and run in your browser:
| Tool | Purpose |
|---|---|
| Python | The primary programming language for data science |
| Pandas | Data manipulation and analysis |
| Matplotlib / Seaborn / Plotly | Data visualization |
| scikit-learn | Machine learning algorithms and preprocessing |
| Google Colab | Browser-based Jupyter notebooks with free GPU access |
| GitHub | Version control and code sharing |
You don't need to install anything. All work in this course is done in Google Colab — a free, cloud-based Python environment that runs in your browser.
What This Course Covers
This course is structured as a progression from fundamentals to advanced topics:
| Module | Content |
|---|---|
| 01 | Introduction to Data Science (this module) |
| 02 | Python for Data Science |
| 03 | Pandas — Data Manipulation |
| 04 | Data Visualization |
| 05 | Exploratory Data Analysis |
| 06 | Relational Databases and SQL |
| 07 | Introduction to Machine Learning |
| 08–10 | Applied Case Studies |
| 11–12 | Regression |
| 13 | Advanced ML Models |
| 14 | Deep Learning |
| 15 | NLP |
| 16–17 | Capstone Projects |
Each module builds on the previous ones. The skills compound.
Conclusion
Data science is the practice of turning raw data into understanding, prediction, and decisions. It combines programming, statistics, and domain expertise through a repeatable lifecycle: define the problem, collect and clean data, explore, model, communicate, and deploy. The field is broad — data analysts, data scientists, ML engineers, and data engineers all operate within it. This curriculum will take you from the beginning of that journey to a point where you can independently tackle real data problems. In the next lesson, you'll set up the primary tool you'll use for all hands-on work: Google Colab and Jupyter Notebooks.